Tactile Graphics: What They Are, How They Work, and Why They Matter
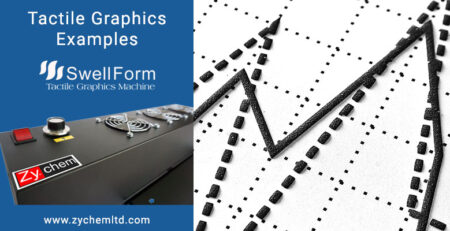
Tactile graphics are visual representations of information that are designed to be explored through touch rather than sight. They are used to convey non-textual information—such as maps, charts, diagrams, and illustrations—to individuals who are blind or visually impaired.
By translating visual content into raised lines, shapes, and textures, tactile graphics allow users to access information that would otherwise only be available visually.
Why Tactile Graphics Are Important
Tactile graphics play a critical role in education and accessibility.
Sighted students rely heavily on visual materials such as images, videos, and diagrams. For blind and visually impaired learners to access the same information, tactile materials must be provided in a format they can interpret through touch.
Without tactile graphics, many concepts—especially those involving spatial relationships, structure, or data—are difficult to fully understand.
Understanding Comes Before Interpretation
Tactile graphics are not automatically meaningful.
For a tactile graphic to be effective, the user must already have some understanding of the concept being represented. For example, a raised map will only be useful if the learner understands what a map represents and how to interpret spatial relationships.
This is why tactile graphics are most effective when combined with instruction, real-world examples, and guided learning.
How Tactile Graphics Are Created
There are many ways to create tactile graphics, ranging from simple manual methods to advanced production techniques.
Manual and DIY Methods
In classrooms and home environments, tactile graphics are often created using simple materials such as:
- Yarn, glue, and cardboard
- Sand, fabric, or textured materials
- Craft materials like foam, wire, or clay
- The ways to create tactile graphics are nearly limitless, depending on the materials, tools, and creativity involved.
These methods allow for creativity and customization, but they can be time-consuming and less consistent.
Three-dimensional models are also commonly used, especially for representing real-world objects. In many cases, physical models are easier to understand than flat graphics, particularly for complex or unfamiliar concepts.
Swell Paper
Modern technology has made it easier to produce tactile graphics quickly and consistently.
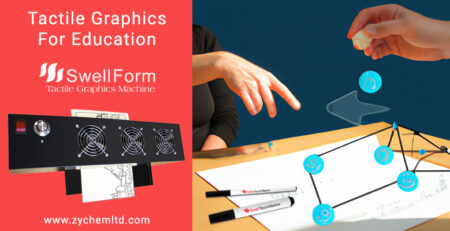
Graphics can be created digitally using software such as vector design tools, then printed onto swell paper. When exposed to heat using a tactile graphics machine, the printed areas expand to form raised tactile graphics.
This method allows educators and organizations to produce tactile graphics efficiently and share digital files for reuse.
Embossing and Thermoforming
Other production methods include embossing and thermoforming.
Embossing is commonly used for braille and precise tactile text, while thermoforming is used for producing durable tactile graphics and duplicates in higher volumes. These methods are often used in specialized production environments.
Key Principles of Effective Tactile Graphics
Creating effective tactile graphics requires more than simply converting visual content. Certain design principles are essential to ensure clarity and usability.
Simplicity and Focus
Tactile graphics should focus on the most important elements.
Too much detail can make graphics difficult to interpret. Simplifying the design helps users understand the key message more easily.
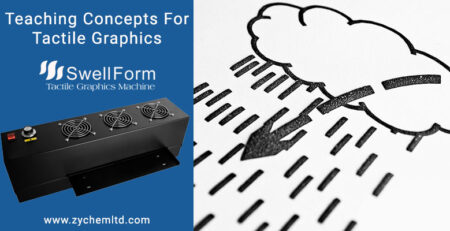
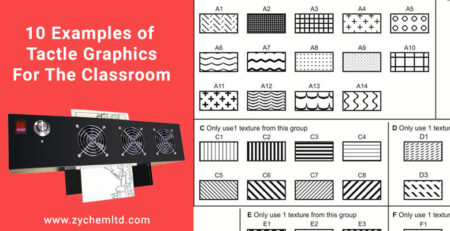
Use of Texture
Textures are used in tactile graphics in the same way color is used in visual graphics—to differentiate elements.
Different materials or raised patterns can represent different objects or surfaces, but they must be used consistently and meaningfully.
Size and Scale
Objects must be large enough to be easily explored by touch.
Small or overly detailed elements are difficult to distinguish, especially for new learners.
Consistency
Consistency helps users recognize objects and patterns.
If an element is represented one way in one graphic, it should be represented the same way in others. This consistency builds familiarity and improves comprehension.
Orientation and Layout
The layout of tactile graphics should be predictable.
Consistent placement of elements, labels, and orientation cues helps users navigate the graphic more easily and understand the relationships between elements.
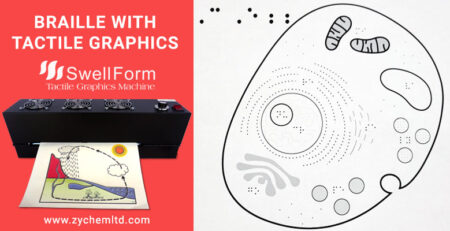
Braille Integration into Graphics
Braille is often included alongside tactile graphics to provide additional context. If using non-traditional methods of braille, like braille on swell paper for example, simpler is better as the braille may not meet authority standards.
Choosing the Right Method
Different methods serve different needs:
• Swell paper: Fast, detailed, and flexible—ideal for classroom use and on-demand tactile graphics
• Embossing: Best for braille and precise tactile text applications
• Thermoforming: Best for high-volume production and durable materials
• Manual / DIY methods: Useful for demonstrations, creative learning, and highly customized graphics
In many cases, a combination of methods is used depending on the learning environment and the complexity of the material.
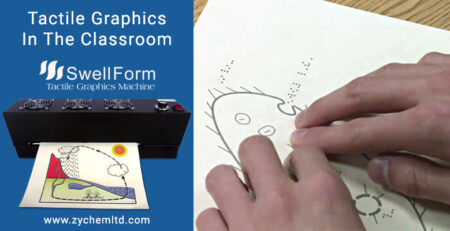
The Role of Tactile Graphics in Education
Tactile graphics are a key component of accessible education.
They allow blind and visually impaired students to engage with the same concepts as their peers, particularly in subjects such as:
- Mathematics and geometry
- Science and biology
- Geography and maps
- Data visualization
When used effectively, tactile graphics support independence, improve comprehension, and create a more inclusive learning experience.
Conclusion
Tactile graphics are an essential tool for making information accessible.
From simple handmade models to advanced production methods, they provide a way to translate visual information into a format that can be understood through touch.
By combining thoughtful design, appropriate production methods, and strong educational context, tactile graphics enable more effective learning and greater accessibility for individuals who are blind or visually impaired.