Examples of Tactile Graphics in Teaching Lessons
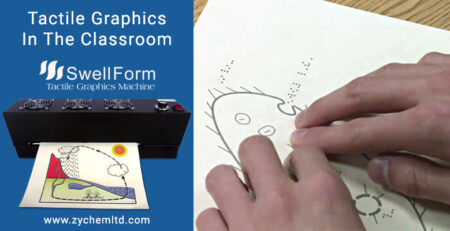
Tactile graphics are raised representations of information that can be explored through touch. They are widely used to support teaching and learning for students who are blind or visually impaired, but they are also highly effective for reinforcing concepts for sighted learners.
By incorporating tactile graphics into lesson plans, educators can present information in a way that is interactive, accessible, and easier to understand.
Below are several examples of how tactile graphics can be used in teaching.
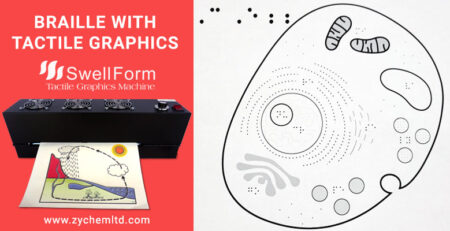
Scientific Concepts
Tactile graphics are highly effective for teaching scientific concepts, such as how a cell functions or how systems interact.
By feeling the different parts of a tactile graphic, students can better understand the relationships between structures and how they work together. This hands-on approach makes complex scientific ideas more tangible and easier to grasp.
Maps and Geography
Tactile graphics can be used to teach geography by allowing students to explore the shapes and locations of countries, states, and cities.
Through touch, students can develop a stronger understanding of spatial relationships, distances, and orientation. This is particularly valuable for students who are blind or visually impaired, as it provides direct access to geographic information.
Charts and Data Representation
Tactile graphics can also be used to represent data, such as trends over time.
For example, a tactile graphic of stock market performance can allow students to feel changes in values and patterns. This helps them understand relationships between data points and how those relationships evolve over time.
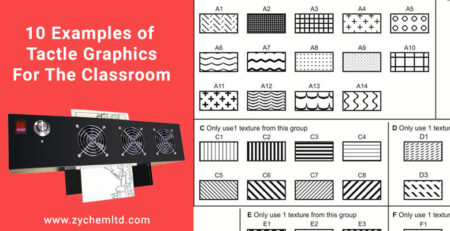
Mathematical Concepts
Mathematics is another area where tactile graphics are especially effective.
Concepts such as geometry, angles, and fractions can be difficult to understand through text alone. By exploring shapes and relationships through touch, students can develop a clearer understanding and improve problem-solving skills.
Why Tactile Graphics Are Effective
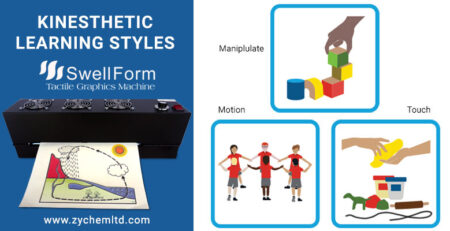
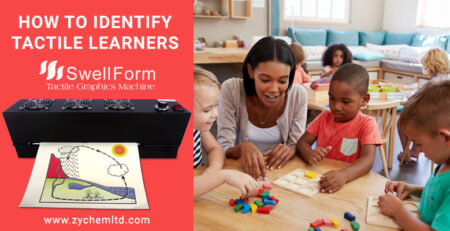
Tactile graphics are a powerful tool because they engage multiple senses and support different learning styles.
They are particularly important for students who are blind or visually impaired, but they also enhance learning for sighted students by reinforcing concepts through physical interaction.
This makes tactile graphics an essential part of an inclusive and effective teaching strategy.
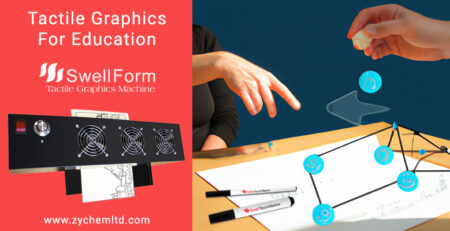
Creating Tactile Graphics for the Classroom
Educators can now create tactile graphics quickly and efficiently using swell paper.
By printing designs onto Swell Touch paper and processing them through a Swell Form machine, printed areas expand to form raised tactile graphics.
This allows teachers to produce high-quality teaching materials on demand, without the need for specialized tools or long production times.
Conclusion
Tactile graphics provide a practical and effective way to teach a wide range of concepts, from science and geography to mathematics and data analysis.
By incorporating tactile graphics, swell paper, and Swell Form machines into lesson plans, educators can create more engaging, accessible, and impactful learning experiences for all students.