Specific examples of tactile graphics teaching lessons
Tactile graphics are visual representations of information that can be felt by touch, and they are often used to teach lessons to people who are blind or visually impaired. Here are some examples of how tactile graphics can be used to teach lessons:
- Scientific Concepts:
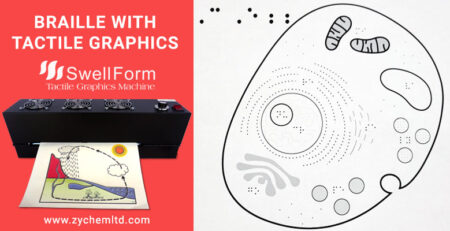
Tactile graphics can be used to teach students about scientific concepts, such as how a cell functions. By feeling the different parts of the diagram, students can gain a better understanding of the relationships between different components. - Maps:
Tactile graphics can be used to teach students about geography by allowing them to feel the shapes and locations of different countries, states or cities. This can help students to better understand spatial relationships and develop their sense of direction. - Charts and Diagrams
Using the stock market as an example, tactile graphics can be used to teach students about how the market has changed over a certain period of time. This can help students to understand the changes over time and how they relate to one another. - Math Concepts:
Tactile graphics can be used to teach students about mathematical concepts, such as geometry and fractions. By feeling the shapes and sizes of different objects, students can develop their understanding of math concepts and learn how to solve problems.
Tactile graphics are an essential and beneficial tool in a teacher’s curriculum for both sighted and visually impaired students to address all types of learning styles.
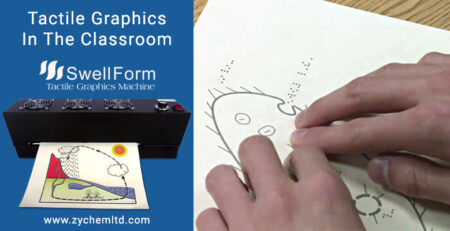
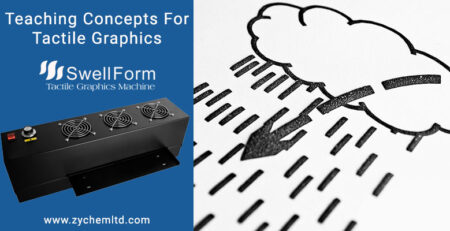
Producing tactile graphics teaching aids can be achieved by using a Swell Form machine and Swell Touch paper (specialized paper for creating raised graphics).
Additionally, the Tactile Library at https://tactilelibrary.com offers thousands of free, pre-made and downloadable documents with many of the concepts mentioned above so teachers can easily build a tactile lesson plan.

